Dataset
Using the following dataset from Kaggle, League of Legends Diamond Ranked Games (10 min), let’s determine whether or not the blue team wins. The dataset gives us the number of wards placed and the number of wards destroyed by each team; which team obtained first blood; the number of kills, deaths, and assists of each team; the number of elite monsters, dragons, and heralds that were killed by each team; the number of towers destroyed by each team; and the amount of gold and experience obtained by each team along with the minions and jungle minions killed by each team by 10 minutes into the match.
Feature Importance
The crux of the issue is to find out what are the most important factors that can change a game’s outcome. This is where feature importance comes into play. Feature importance is a technique where we assign a score to input features based on how useful they are at predicting a target variable. Thus, the top features in our feature importance analysis will affect whether the blue team wins or losses to most.
We will specifically use permutation feature importance to obtain the scores we assign to the input features. Permutation feature importance is defined to be the decrease in a model score when a single feature value is randomly shuffled. This allows us to avoid any bias towards features with high cardinality.
There are a lot of redundant features since the mean and standard deviation of their importances are exactly the same as well as they are representing the same statistic. These features are
- redTotalGold and redGoldPerMin
- blueTotalGold and blueGoldPerMin
- blueKills and redDeaths
- redKills and blueDeaths
- blueExperienceDiff and redExperienceDiff
- blueGoldDiff and redGoldDiff
- blueTotalMinionsKilled and blueCSPerMin
- redTotalMinionsKilled and redCSPerMin
- blueFirstBlood and redFirstBlood
We will drop all latter features due to the former feature being either easier to track or blue team related. The features that are blue team related has a red team feature counterpart that tells the exact same statistic. There is also the gameId feature that doesn’t influence the outcome of the game at all so we will drop that too. Finally we will drop all features that have an importance mean of zero. This is because of how insignificant those features are to the actual outcome of the match.
- blueAvgLevel
- blueWardsDestroyed
- redAvgLevel
- redWardsDestroyed
- blueAssists
- redAssists
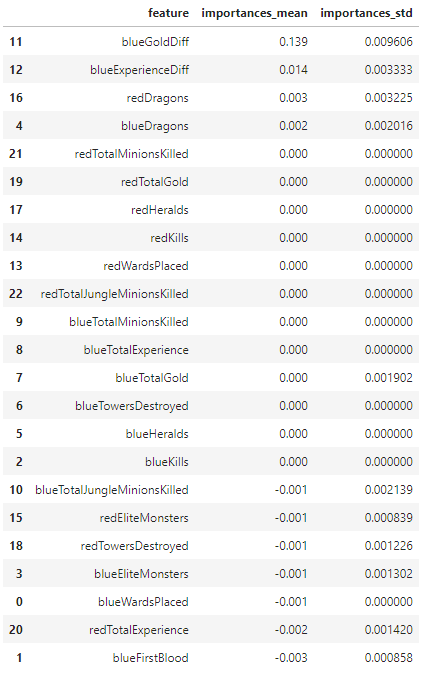
The following graph represents the current features for the logistic regression model after removing the above features.
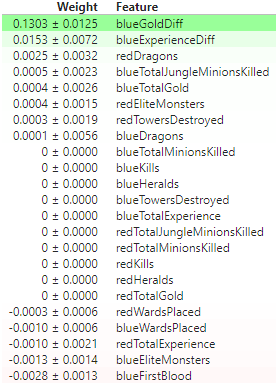
Now using the eli5 library, which is short for Explain it Like I’m 5, we can produce a colorized version of our final feature importances.
Total Gold vs Gold Difference
We can see above that the top two factors that determine the outcome of a match are the total amount of gold for each team vs the gold difference between the teams. By using a Partial Dependence Plot (PDP) interact, we can see how the prediction depends on the the input variables.
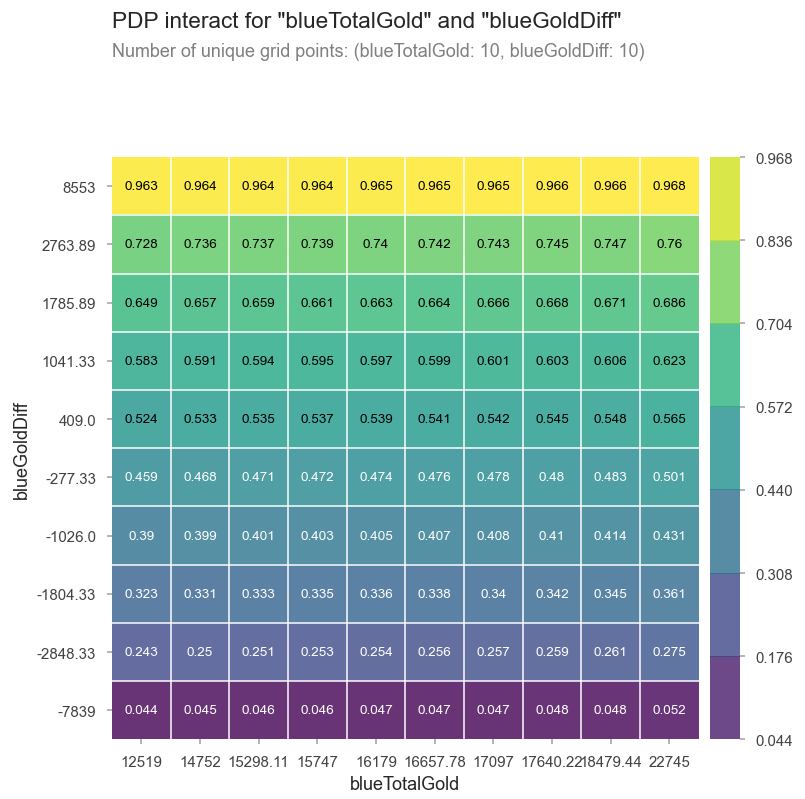
By looking at the changes between the prediction dependancies as either the gold difference increases or the total amount of gold increases, we can definitely say that the outcome of a match is more dependant on an increasing gold difference than an increasing total amount of gold. Thus, we can summerize that in order to win a match in League of Legends, the most important factor would be to create a gold advantage between your team and the enemy team.
Target, Metric, and Baseline
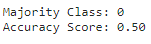
Our target for this dataset is the blueWins feature telling us whether the blue team won with a 1, and otherwise a 0. Thus, we will be using logistic regression and random forest classifier from the sklearn library to fit this binary classification. This will allow us to obtain the accuracy of our model by scoring the model’s predictions based on the actual values in our dataset. We are using accuracy since our classes are balanced. An easy way to judge whether our models are sufficient is by comparing their accuracy scores with a baseline prediction.
There were no features that would leak the outcome of the match. Logistic regression and random forest classifier are among the easiest as well as the best models to use when dealing with binary classification. If one could score higher AUC as well as validation accuracy with logistic regression, then they should use logistic regression due to how computationally heavy fitting a random forest classifier is in comparison.
With this dataset, if we predict that blue always loses, we will be right half of the time. In other words our baseline model is predicting the blue team to always loses with an accuracy score of 0.50. The following is the code to find the majority class between the two possible outcomes and our model’s accuracy score.
Logistic Regression
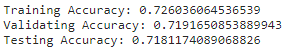
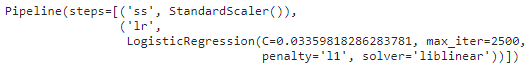
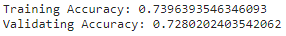
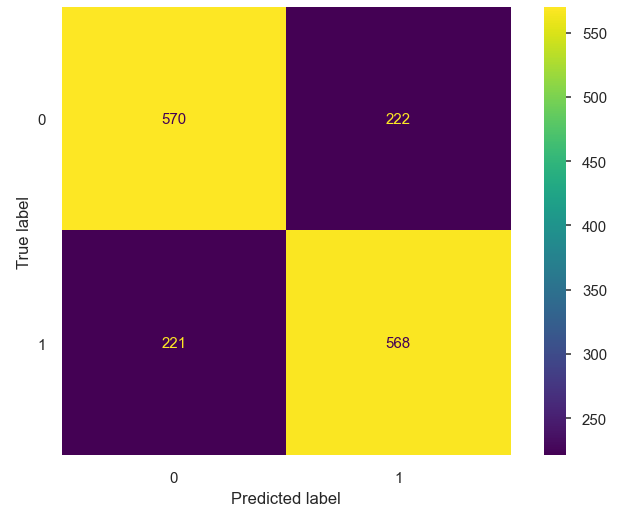
For our logistic regression, we will import the model from sklearn.liner_model, as well as import make_pipeline from sklearn.pipeline, and standardscaler from sklearn.preprocessing. This enables us to create a pipeline so we can scale the data and fit to the model simultaneously. We obtained a training accuracy of 0.74 and a validation accuracy of 0.72, which is great compared to our baseline score of 0.50.
We can observe a confusion matrix of our log model’s predictions against the true values to see how many of the predictions were correct.
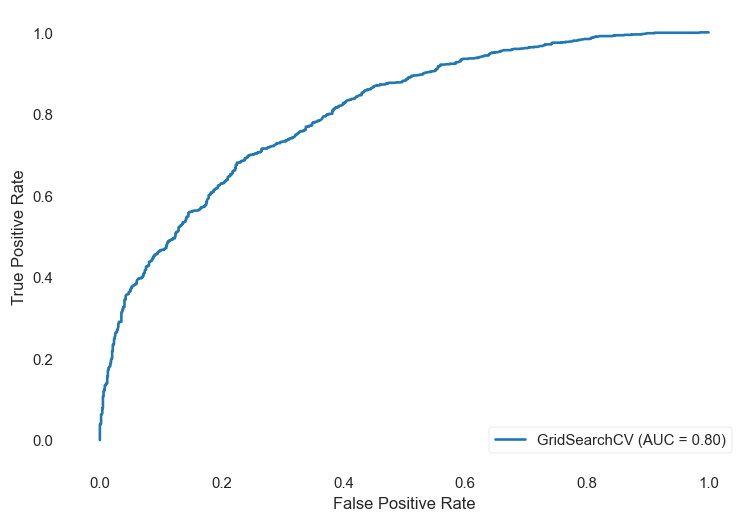
Logistic Regression ROC-AUC
Furthermore, we go ahead and obtain the Receiver Operating Characteristic (ROC) curve as well as the Area Under the ROC Curve (AUC). This allows us to measure how well our model is able to distringuish between classes. The higher the AUC is, the better the model is at predicting 0s as 0s and 1s as 1s. The ROC curve is plotted with the True Positive Rate (TPR) against the False Positive Rate (FPR), where the TPR is on the y-axis and the FPR is on the x-axis.
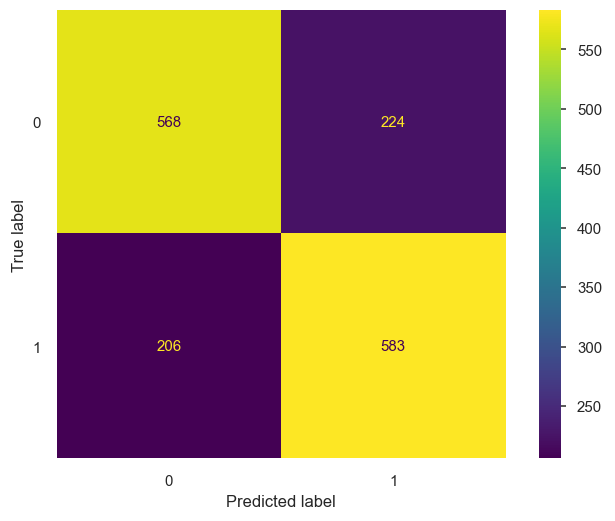
Random Forest Classifier
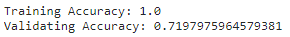
For our random forest classifier, we will import the model from sklearn.ensemble. We obtained a training accuracy of 1.00 and a validation accuracy of 0.72, which is great compared to our baseline score of 0.50. However, we must bare in mind that our model extremely overfits our training dataset due to the accuracy score of 100%.
We can contrastly observe a confusion matrix of our random forest model’s predictions against the true values to see how many of the predictions were correct.
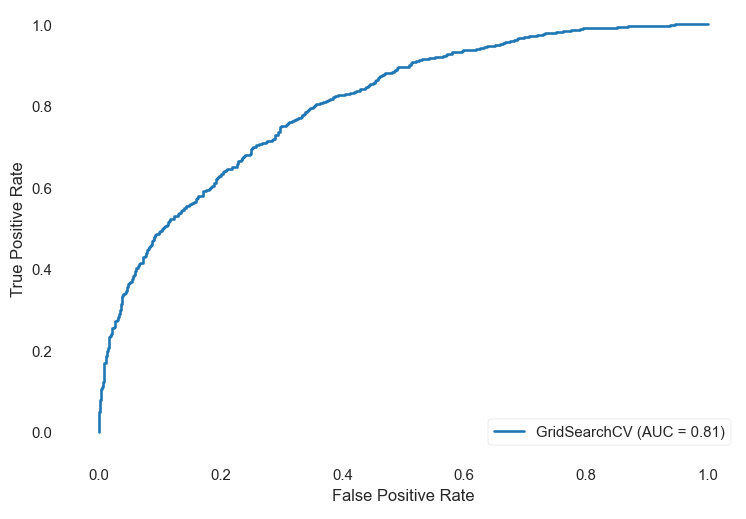
Random Forest Classifier ROC-AUC
Now we will go ahead and find the ROC-AUC of our random forest classifier.
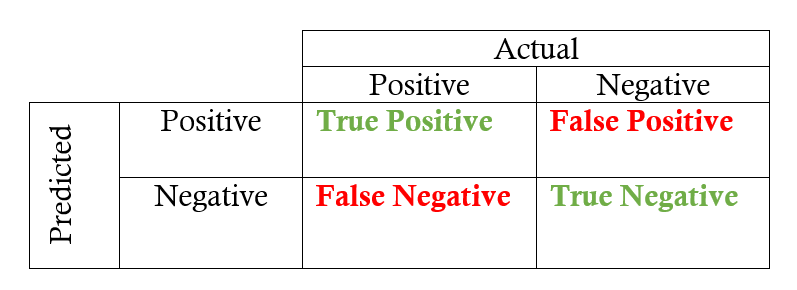
ROC-AUC Explanation
TPR is obtained by calculating TP / (TP + FN), or by dividing all the correctly predicted wins by the actual number of wins in the dataset. FPR is obtained by calculating FP / (TN + FP), or by dividing all the correctly predicted losses by the actual number of losses in the dataset.
Conclusion
There are a lot of factors that lead to victory in a game. In general, amassing resources is a good start to wining, but it is a fruitless endeavor if your opponent can do the same. Therefore, in order to win, one must create a difference between themselves and the enemy that is beneficial to oneself. In League of Legends, the most important statistic to have an advantage over is the amount of gold your team has. Thus, it is in everyone’s best interest to not only accrue gold, but to also prevent the enemy from accumulating their own wealth as well. Here’s a link to the notebook to view all code that was used to produce the graphs above.
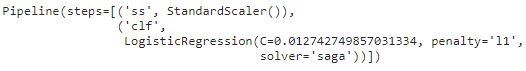
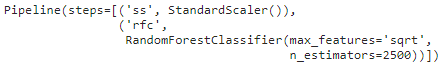
For my web app, I used the follow pipeline as my final model since the validation accuracy score was higher for the Logistic Regression model compared to the Random Forest Classifier. I also only used the easiest to obtain features, which were ‘blueTowersDestroyed’, ‘blueTotalGold’, ‘blueKills’, ‘redKills’, ‘redTotalGold’, ‘redTowersDestroyed’, ‘blueGoldDiff’, to make it easier for the user to use the predictor.